Concepts
Before using OpenSearch Benchmark, familiarize yourself with the following concepts.
Core concepts and definitions
-
Workload: The description of one or more benchmarking scenarios that use a specific document corpus to perform a benchmark against your cluster. The document corpus contains any indexes, data files, and operations invoked when the workflow runs. You can list the available workloads by using
opensearch-benchmark list workloadsor view any included workloads in the OpenSearch Benchmark Workloads repository. For more information about the elements of a workload, see Anatomy of a workload. For information about building a custom workload, see Creating custom workloads. - Pipeline: A series of steps occurring before and after a workload is run that determines benchmark results. OpenSearch Benchmark supports three pipelines:
from-sources: Builds and provisions OpenSearch, runs a benchmark, and then publishes the results.from-distribution: Downloads an OpenSearch distribution, provisions it, runs a benchmark, and then publishes the results.benchmark-only: The default pipeline. Assumes an already running OpenSearch instance, runs a benchmark on that instance, and then publishes the results.
- Test: A single invocation of the OpenSearch Benchmark binary.
A workload is a specification of one or more benchmarking scenarios. A workload typically includes the following:
- One or more data streams that are ingested into indexes.
- A set of queries and operations that are invoked as part of the benchmark.
Throughput and latency
At the end of each test, OpenSearch Benchmark produces a table that summarizes the following:
- Service time
- Throughput
- Latency
- The error rate for each completed task or OpenSearch operation.
While the definition for throughput remains consistent with other client-server systems, the definitions for service time and latency differ from most client-server systems in the context of OpenSearch Benchmark. The following table compares the OpenSearch Benchmark definition of service time and latency versus the common definitions for a client-server system.
| Metric | Common definition | OpenSearch Benchmark definition |
|---|---|---|
| Throughput | The number of operations completed in a given period of time. | The number of operations completed in a given period of time. |
| Service time | The amount of time that the server takes to process a request, from the point it receives the request to the point the response is returned. </br></br> It includes the time spent waiting in server-side queues but excludes network latency, load balancer overhead, and deserialization/serialization. | The amount of time that it takes for opensearch-py to send a request and receive a response from the OpenSearch cluster. </br> </br> It includes the amount of time that it takes for the server to process a request and also includes network latency, load balancer overhead, and deserialization/serialization. |
| Latency | The total amount of time, including the service time and the amount of time that the request waited before responding. | Based on the target-throughput set by the user, the total amount of time that the request waited before receiving the response, in addition to any other delays that occured before the request is sent. |
For more information about service time and latency in OpenSearch Benchmark, see the Service time and Latency sections.
Service time
OpenSearch Benchmark does not have insight into how long OpenSearch takes to process a request, apart from extracting the took time for the request. In OpenSearch, service time tracks the amount of time between when OpenSearch issues a request and receives a response.
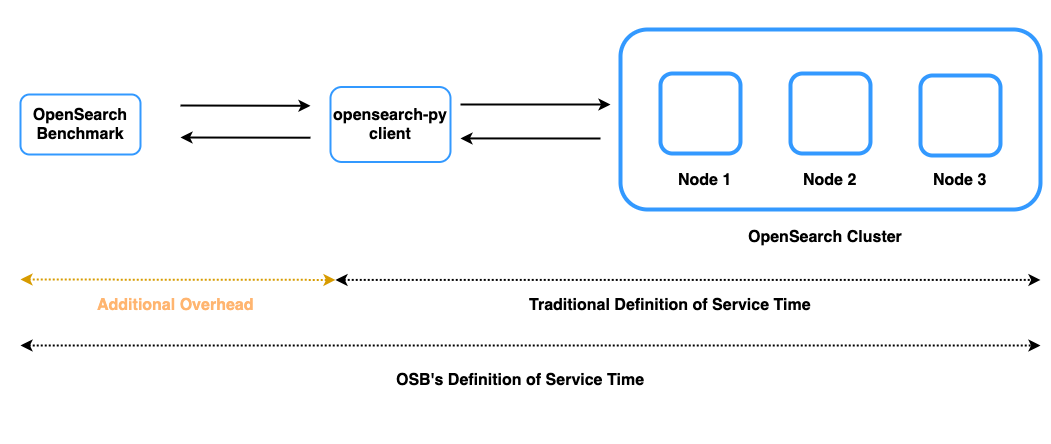
OpenSearch Benchmark makes function calls to opensearch-py to communicate with an OpenSearch cluster. OpenSearch Benchmark tracks the amount of time between when the opensearch-py client sends a request and receives a response from the OpenSearch cluster and considers this to be the service time. Unlike the traditional definition of service time, the OpenSearch Benchmark definition of service time includes overhead, such as network latency, load balancer overhead, or deserialization/serialization. The following image highlights the differences between the traditional definition of service time and the OpenSearch Benchmark definition of service time.
Latency
Target throughput is key to understanding the OpenSearch Benchmark definition of latency. Target throughput is the rate at which OpenSearch Benchmark issues requests, assuming that responses will be returned instantaneously. target-throughput is one of the common workload parameters that can be set for each test and is measured in operations per second.
OpenSearch Benchmark always issues one request at a time for a single client thread, specified as search-clients in the workload parameters. If target-throughput is set to 0, OpenSearch Benchmark issues a request immediately after it receives the response from the previous request. If the target-throughput is not set to 0, OpenSearch Benchmark issues the next request to match the target-throughput, assuming that responses are returned instantaneously.
Example A
The following diagrams illustrate how latency is calculated with an expected request response time of 200ms and the following settings:
search-clientsis set to1.target-throughputis set to1operation per second.
When a request takes longer than 200ms, such as when a request takes 1110ms instead of 400ms, OpenSearch Benchmark sends the next request that was supposed to occur at 4.00s based on the target-throughput at 4.10s. All subsequent requests after the 4.10s request attempt to resynchronize with the target-throughput setting.
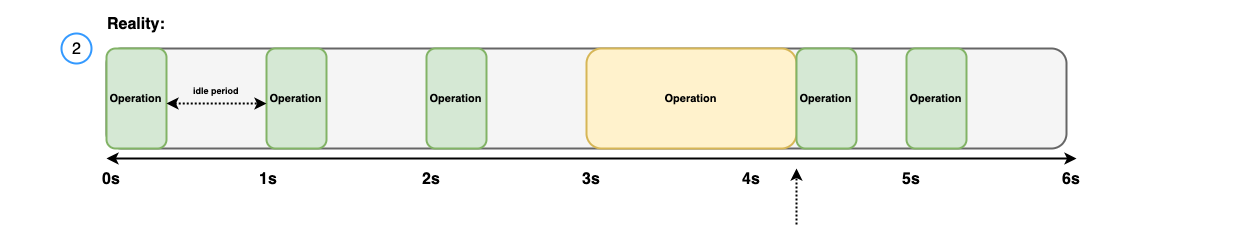
When measuring the overall latency, OpenSearch Benchmark includes all performed requests. All requests have a latency of 200ms, except for the following two requests:
- The request that lasted 1100ms.
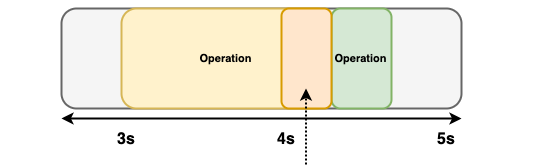
- The subsquent request that was supposed to start at 4:00s. This request was delayed by 100ms, denoted by the orange area in the following diagram, and had a response time of 200ms. When calculating the latency for this request, OpenSearch Benchmark will account for the delayed start time and combine it with the response time. Thus, the latency for this request is 300ms.
Example B
In this example, OpenSearch Benchmark assumes a latency of 200ms and uses the following latency settings:
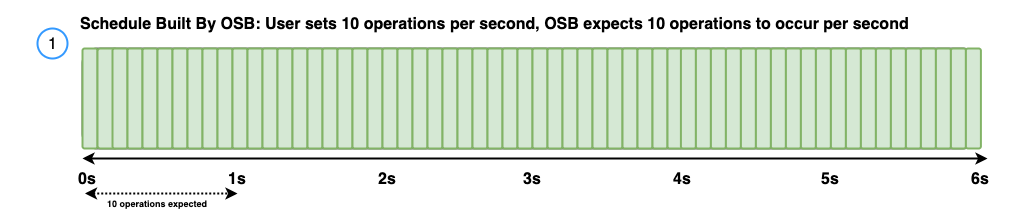
search_clientsis set to1.target-throughputis set to10operations per second.
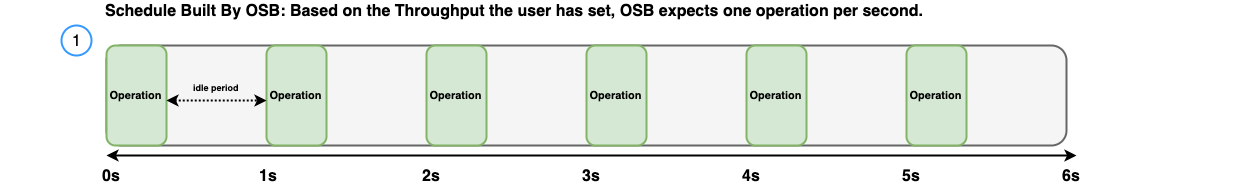
The following diagram shows the schedule built by OpenSearch Benchmark with the expected response times.
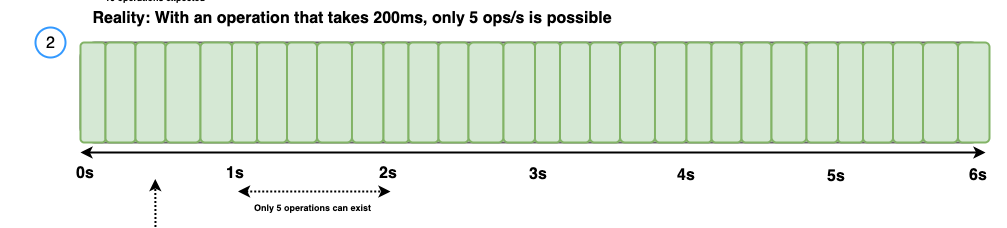
However, if the assumption is that all responses will take 200ms, 10 operations per second won’t be possible. Therefore, the highest throughput OpenSearch Benchmark can reach is 5 operations per second, as shown in the following diagram.
OpenSearch Benchmark does not account for this and continues to try to achieve the target-throughput of 10 operations per second. Because of this, delays for each request begin to cascade, as illustrated in the following diagram.
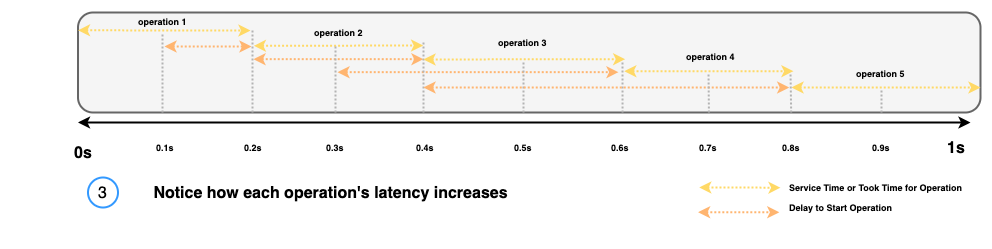
Combining the service time with the delay for each operation provides the following latency measurements for each operation:
- 200 ms for operation 1
- 300 ms for operation 2
- 400 ms for operation 3
- 500 ms for operation 4
- 600 ms for operation 5
This latency cascade continues, increasing latency by 100ms for each subsequent request.
Recommendation
As shown by the preceding examples, you should be aware of the average service time of each task and provide a target-throughput that accounts for the service time. The OpenSearch Benchmark latency is calculated based on the target-throughput set by the user, that is, the latency could be redefined as “throughput-based latency.”